Understanding Medians and Quartiles
Medians and quartiles are often more difficult for people to wrap their head around than the mean and standard deviation. The median value is simply the value in the middle of a sample distribution if you line the sample up from smallest to biggest. If you have 5 values in your sample, and you line them up from biggest to smallest, the median is the value in the third spot (the middle).
If you know the median value, you know that half of the values in the sample are bigger than that, and half of the values are smaller than that. So when you see a reported median in a manuscript, just think, “Okay, that’s the middle value. The half-way point”.
In many ways, the median is a more useful measure than the mean, but the mean is the value people default to using. When a distribution is symmetrical, the mean and the median will be the same. Both tell us where a center of the distribution is located [1]Median tells us where the center of the list is, and Mean tells us where the center of weight is, like we were weighing our samples on a scale. But if the distribution is skewed, the mean can be very misleading as a measure of the ‘center’ if you don’t know there’s skew.
Example: Take Bill Gates’ graduating high school class from Lakeside High School in Seattle. Let’s assume there were 175 kids in his graduating class. Let’s assume outside of Bill his graduating class overall today has the average net worth of that age bracket in the United States, or about $180,000 per individual. As of 2017, Bill Gates is worth 88 billion dollars. $88,000,000,000.00 is a big number; much much bigger than the other members of that sample.
If you take the average net worth today of the individuals in Bill Gates’ graduating class (add up $180,000 times 174 people, add $88 billion for Bill, and divide by 175), you get the average net worth value of $503 million per person. That’s astoundingly non-representative of what the individual people in that sample really have! The truth is there are 174 people worth $180,000, and one dude worth $88 billion that’s skewing the average WAAAAAAY towards his insane net worth. But if all you looked at was the average value of $503 million per individual, you’d think his high school class was the most successful in the history of the world.
So the mean value will always be skewed in the direction of the extreme outliers, and the more extreme the outliers the more messed up the mean becomes. So when a sample is skewed to one side or the other, the mean is a poor way to characterize the sample.
The median value, on the other hand, always tells you the halfway point, and (unless the sample distribution is really strange), will tell you where most of the “mass” of the sample is located. In the example above the median value is $180,000 – a more accurate representation of the true value of the typical individual in the graduating class [2]Note in this case, however, that if all you saw was the median value you would miss that there was one extraordinary outlier in that group, so we’ve lost a different kind of information in this case.
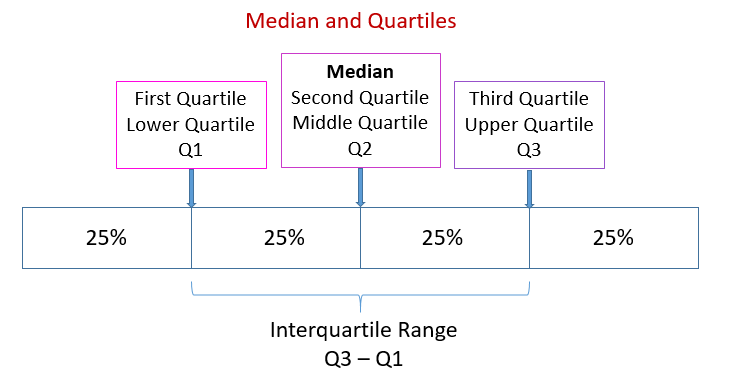
Like standard deviation describes the spread of a distribution when using the mean, the quartiles (25th and 75th) tell you the spread when using medians. The 25th tells you that 25% of the samples is below this value and 75% is above, and vice-versa. These values are simply the values halfway between the median and the two ends of the sample.
Reporting Mean vs. Median
See the section on understanding tests of normality to understand when treating your data as parametric is probably okay, versus when it probably isn’t. The same general rules apply to reporting the mean versus the median:
- If your sample is normally distributed, you can reasonably report mean/SD no matter how small it is.
- If your sample is not normally distributed, it must be sufficiently large that the central limit theorem takes effect, in order for mean/SD reporting to be reliable. “Sufficiently large” is the trick. 40-50 samples is going to be sufficient for most any practical application. 30-40 is borderline, and < 30 is probably unsafe.
- If reporting the mean does not apply, report the median.
In research reports, it‘s never ‘wrong’ to report the median and quartiles, but sometimes it is wrong or misleading to report the mean. When in doubt, use median and quartiles and use non-parametric tests.
One other caveat to consider: if you are going to use the results of your summary values (mean or median) to calculate something about a group or collection of members of the sample, then mean is more appropriate in most cases. If you are using your summary values to report something about a typical single member of the set, then the median will be a better representation.
References
| 1. | ↑ | Median tells us where the center of the list is, and Mean tells us where the center of weight is, like we were weighing our samples on a scale |
| 2. | ↑ | Note in this case, however, that if all you saw was the median value you would miss that there was one extraordinary outlier in that group, so we’ve lost a different kind of information in this case |