Normality and Parametric Testing
 Continuous variables usually need to be further characterized so we know whether they can be treated as either Parametric or Non-parametric, so they can be reported and tested appropriately. Note that while in practice Parametric/Non-parametric and Normal/non-normal are sometimes used interchangeably, they are not the same. Usually we want to know whether a variable is parametric or not, but the easiest way to do this is to test whether it is normal or not, so the terms get a bit mixed up sometimes [1]Technically, it’s more subtle even than that, because some parametric distributions like Cauchy don’t have finite means and therefore aren’t appropriate for parametric testing. We’re going to dive a little deeper here, and this is so essential to basic statistics that it’s really worth knowing, but if you just need to know what to do skip down to “So what do I do?” at the bottom.
Normal vs. Non-Normal
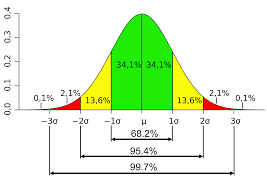
The Normal Distribution is the classic bell-curve shape. It can be narrower or wider depending on the variance of the population, but it is perfectly symmetrical, and the ends of the distribution extend “infinitely” in both directions (though in practice the probabilities are so low beyond 4-5 standard deviations away from the mean we don’t expect to ever see values out there). The reason the “infinite” ends is relevant, though, is that if your data cannot possibly exist, even in theory, in some part of the real numbers (positive or negative), your data sample cannot be truly normally distributed. For example, neither estimated blood loss, length of stay, age, nor weight can have values less than zero, so these variables cannot ever be truly normally distributed. You’ll note that this means very few variables meet the strictest definition of ‘normally’ distributed. Read on though, because that doesn’t necessarily mean we can’t use parametric statistics for those variables. Most of the time we’re trying to figure out whether or not our variable in question is close enough to normal to treat it as normal.
A non-normal distribution is any distribution of any kind other than normal. Most commonly in practice we find distributions are non-normal because they have a skew (a longer tail on the right or left side), though double-humped distributions and so on are also possible. Length of stay data is a great example: most patients will leave the hospital after some short time interval, but a few patients will have complications and stay longer, with a small handful staying many times longer, giving the distribution a skew (one tail much longer than the other, in this case a right skew). Plus, no patients can stay “less than zero” days, so that tail is going to be limited (and another indication that this variable is not normally distributed.
Parametric vs. Non-parametric Statistics
A Parametric Distribution is essentially a distribution that can be fully described in terms of a set of parameters. A normal distribution with mean=3 and standard deviation=2 is one example using two parameters. Knowing only the mean and SD, we can completely and fully characterize that normal probability distribution. A Poisson distribution with a rate of 5 is another example that requires only one parameter, and again this one parameter is sufficient to fully describe that particular Poisson distribution. Moreover, any two distributions of the same type with the same parameters are identical distributions. There are many types of parametric distributions other than normal, if you’re bored you can look some up (Normal, Poisson, Exponential, Binomial, Beta, Chi-Square, Uniform, Geometric, so on).
Without going into detail, the Central Limit Theorem (CLM, a cornerstone of statistics) states that as long as a distribution has a finite/stable mean value and a finite/stable variance, as the number of samples from that distribution increases the distribution of the mean of the sample becomes normally distributed. Read that again a couple of times if you need to. It’s not saying the sample (i.e. your data itself) becomes normally distributed; your sample is distributed according to “itself”. It’s saying the mean of your sample – if you were to repeat the sampling process many times and record the mean of each sample – that distribution of your mean value over repeated testing becomes normally distributed if the size of each sample increases large enough.
When we know that a distribution is parametric and has finite mean and variance, with a sufficiently large sample we can use parametric statistics. Usually (not always), parametric statistics are more powerful (meaning more likely to find a significant difference between two samples when one exists), so in general researchers like to use them when possible. How many samples are needed for it to be “sufficiently large” is more complicated to prove, but fortunately the rules for implementation are easy (see below).
If we don’t know that our variable of interest meets the criteria for use of parametric statistics, we instead use non-parametric statistics. This happens most often when either we have: 1) data from a known distribution that violates the assumptions of the Central Limit Theorem [2]see the “Cauchy” distribution as the classic pathologic parametric distribution that has undefined mean and variance…it’s a hot mess. It’s the probability distribution equivalent of “Battlefield Earth“; or 2) a very small data sample, so we cannot be sure we have “a big enough sample” to meet the size requirement of the central limit theorem. In practice for medical biostats, #1 is relatively uncommon, fortunately, so it’s mostly condition #2 we worry about.
So, What Do I Do?
- If there is doubt, it is never wrong to use non-parametric approaches. You want to compare two groups of perfectly normal data with huge sample sizes using a non-parametric Mann-Whitney U test? Great! Totally valid, and probably very little difference from a t-test! The only thing you’ve risked is a small loss in power [3]Actually the Mann-Whitney U test in particular is almost as powerful as a t-test across the board, and more powerful in most cases; you could almost make the argument we should get rid of the t-test all together, but that’s a separate story.
- Unless you know you’re working with data from some bizarre distribution (rare in practice), if your sample size is “large enough” (more than around 30), you are almost certainly okay using parametric statistics. Why 30? The short answer is that the less “normal” shaped a distribution is the bigger the sample you need. One of the biggest offenders out there for parametric non-normal distributions is the exponential distribution, and even the most extreme exponential distribution has been shown in simulation to be acceptable for parametric statistics with a sample size of 30 or more.
- If you have less than 30 data points in your sample, you have some options:
- Just play it safe and use non-parametric statistics.
- Test the data for normality – if your data is normally distributed, then it meets the criteria for the CLM no matter how little data you have and you can use parametric tests. Tests for normality can be found in “Single Variable Analyses”
- Attempt to characterize your exact distribution based on your sample. This may involve generating Monte-Carlo bootstrapped samples from your data and you’ll probably need a stats person for this, but it’s really powerful if having a precise description of your variable’s behavior is of value.
- If you choose to use parametric approaches based on the rules above and a manuscript reviewer gives you a hard time (reviewers loooooove to debate parametric vs non-parametric stats; sometimes they’re right, sometimes they’re being unnecessarily pedantic, and in some cases they’re wrong), you can always just switch to non-parametric testing. If this really changes your significance values you have borderline results anyway and should be suspicious of your data in the first place, but a stats person can help you defend your use of parametrics if appropriate and necessary. Most commonly I see feedback like “Length of stay data is positively skewed and thus not appropriate for parametric statistics/t-test”. Well, if you have 30+ samples you now know you can respond and very intelligently and correctly state that “with my sample size of x, we should have more than sufficient data to meet the criteria of the Central Limit Theorem and thus use of parametric statistics are appropriate.” Good luck! YMMV with reviewers, of course.
References
| 1. | ↑ | Technically, it’s more subtle even than that, because some parametric distributions like Cauchy don’t have finite means and therefore aren’t appropriate for parametric testing |
| 2. | ↑ | see the “Cauchy” distribution as the classic pathologic parametric distribution that has undefined mean and variance…it’s a hot mess. It’s the probability distribution equivalent of “Battlefield Earth“ |
| 3. | ↑ | Actually the Mann-Whitney U test in particular is almost as powerful as a t-test across the board, and more powerful in most cases; you could almost make the argument we should get rid of the t-test all together, but that’s a separate story |